
TrialGrid wins prize at Medidata London Next Hackathon with ODM Express
Another blog post, another Medidata Hackathon. This time at the Medidata Next London Event not far from St Paul's Cathedral. Not that anyone participating in the 15+ hour event got to do much sightseeing, ensconced as we were in a basement meeting room of the Grange Hotel.
Hackathons always have an energetic atmosphere and this one was no different. It was great to take part, made even better by winning the event with a demonstration of ODM Express a Real Time Study Metrics Dashboards (more on that later).
If you didn't attend, you missed out on more than just a prize. One of the great things about the Medidata Hackathon, besides the free pizza, is a chance to exchange ideas with Medidata's "backroom" people, the User Experience Experts and Software Engineers you don't otherwise get to work with. Frederick Marc (Medidata, Experience Design) led a Design Thinking session in which we discussed problems facing the industry and then we selected problems we felt we could tackle in the time available and split into teams.
I had an idea in mind that I wanted to pursue and which fit well into one of the areas discussed so for the early part of the day I focused on that. Ross Rothmeier and Ray Grant started to explore 3D visualization techniques while Yi Zhang and Nolan Carroll set up a Patient Cloud study to collect data for a 3D visualization. Between them they came up with a very cool data visualization and I was very pleased to be able to help out in a small way towards the end by setting up some simple hosting for their efforts. Credit especially to Yi and Nolan who tackled the majority of the 3D work.
If you have a pair of VR goggles (a Google Cardboard set, about $10, is a great way to start) check out their Cool 3D Graph Demo
A day is not a lot of time to bring an idea to a demonstrable state. If I have learned anything from previous Hackathons it is that some preparation is vital. You don't want to waste hours on setting up your development environment, getting access to systems etc. Somewhat inspired by Mike Crayne's blog posts on Clinical Dashboards in Excel, I wanted to see what could be done to make a real-time Dashboard for Study Managers from the Medidata Clinical Audits Service A.K.A the ODM Adapter.
The ODM Adapter was designed to feed Data Warehouse projects with a stream of audit data in CDISC ODM format. It tracks events such as Subject Creation, Data Entry and Query Workflow. Every event has a unique identifier which increments over time, making it easy to check for new updates.
ODM Express
Getting data from the Clinical Audits Service is easy, especially if you use the right tools for the job. It took a few minutes to create a processor for the service which read data from the audits service and put it into a flat table structure, creating something very similar to the Rave audit table.
Now I want to push it to a spreadsheet. I'd already investigated the Google Spreadsheets API so I knew how to:
- create a Service Account so that my program could create a spreadsheet using its own credentials
- share the resulting spreadsheet with myself and any other team members that should be invited
- create worksheets and rows of data.
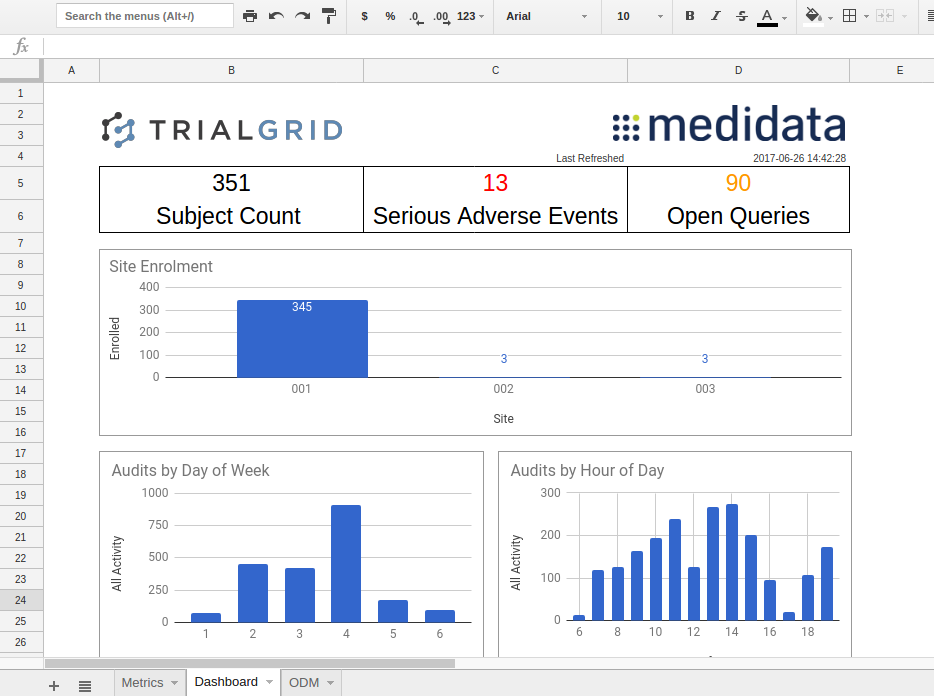
Once the data was being pushed into the spreadsheet I got to work creating calculations using the native Google spreadsheet functions to extract metrics on the type and frequency of events and to create graphs from them. This was made a LOT easier by the fact that Google has included a form of SQL in their Spreadsheet so that I was able to do COUNT() and filtering of data as though it was a real database table.
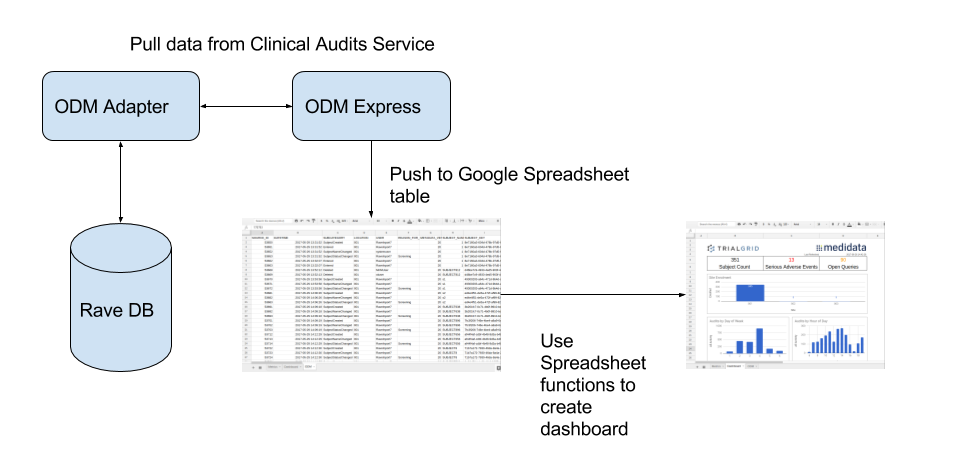
Here's an overview of the process. Pulling data from the ODM Adapter/Clinical Audits Service, pushing to the spreadsheet and then generating the Metrics on a Dashboards page:
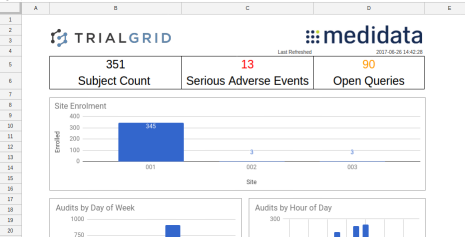
Given the short time available I was fairly pleased with the result:
Conclusion
It's amazing what you can do with a little preparation, some open source software and a few hours of concentrated effort. The result is a proof of concept but what I liked about pushing to the Google spreadsheet:
- You can use spreadsheet functions like conditional formatting to highlight metrics green/orange/red
- You have the full range of Charts that Google includes such as timelines and even gauges (if you want them)
- Using Google's V4 API the charts and metrics update in real time just as if a user was entering the data
- The spreadsheet can be shared with a wider study team and certain sheets protected or the whole sheet made read-only. Team members do not have to have Medidata accounts to see the data.
- Data from Google spreadsheets can be aggregated into other spreadsheets so you can make a Dashboard of Dashboards if you wish.
Of course there are some things which are not so good:
- The v4 API's only allow you to push 100 updates every 60 seconds. ODM Adapter can deliver them faster than that so you have to throttle how fast you send to the spreadsheet.
- A Google Spreadsheet has a maximum of 400,000 cells and a large study could easily reach this number so you would need to select which data was important for your metrics and not send all of it to the spreadsheet.
It was a fun day, many thanks to Medidata and in particular Ross Rothmeier @Medidata for arranging it.